Spectrum Lab

Exploring the world of color

You can click here to replay the Session 3 tutorial later if you need a refresher on this content.

Back
Finish

Challenge

What can spectra tell us about an object’s temperature?

sun

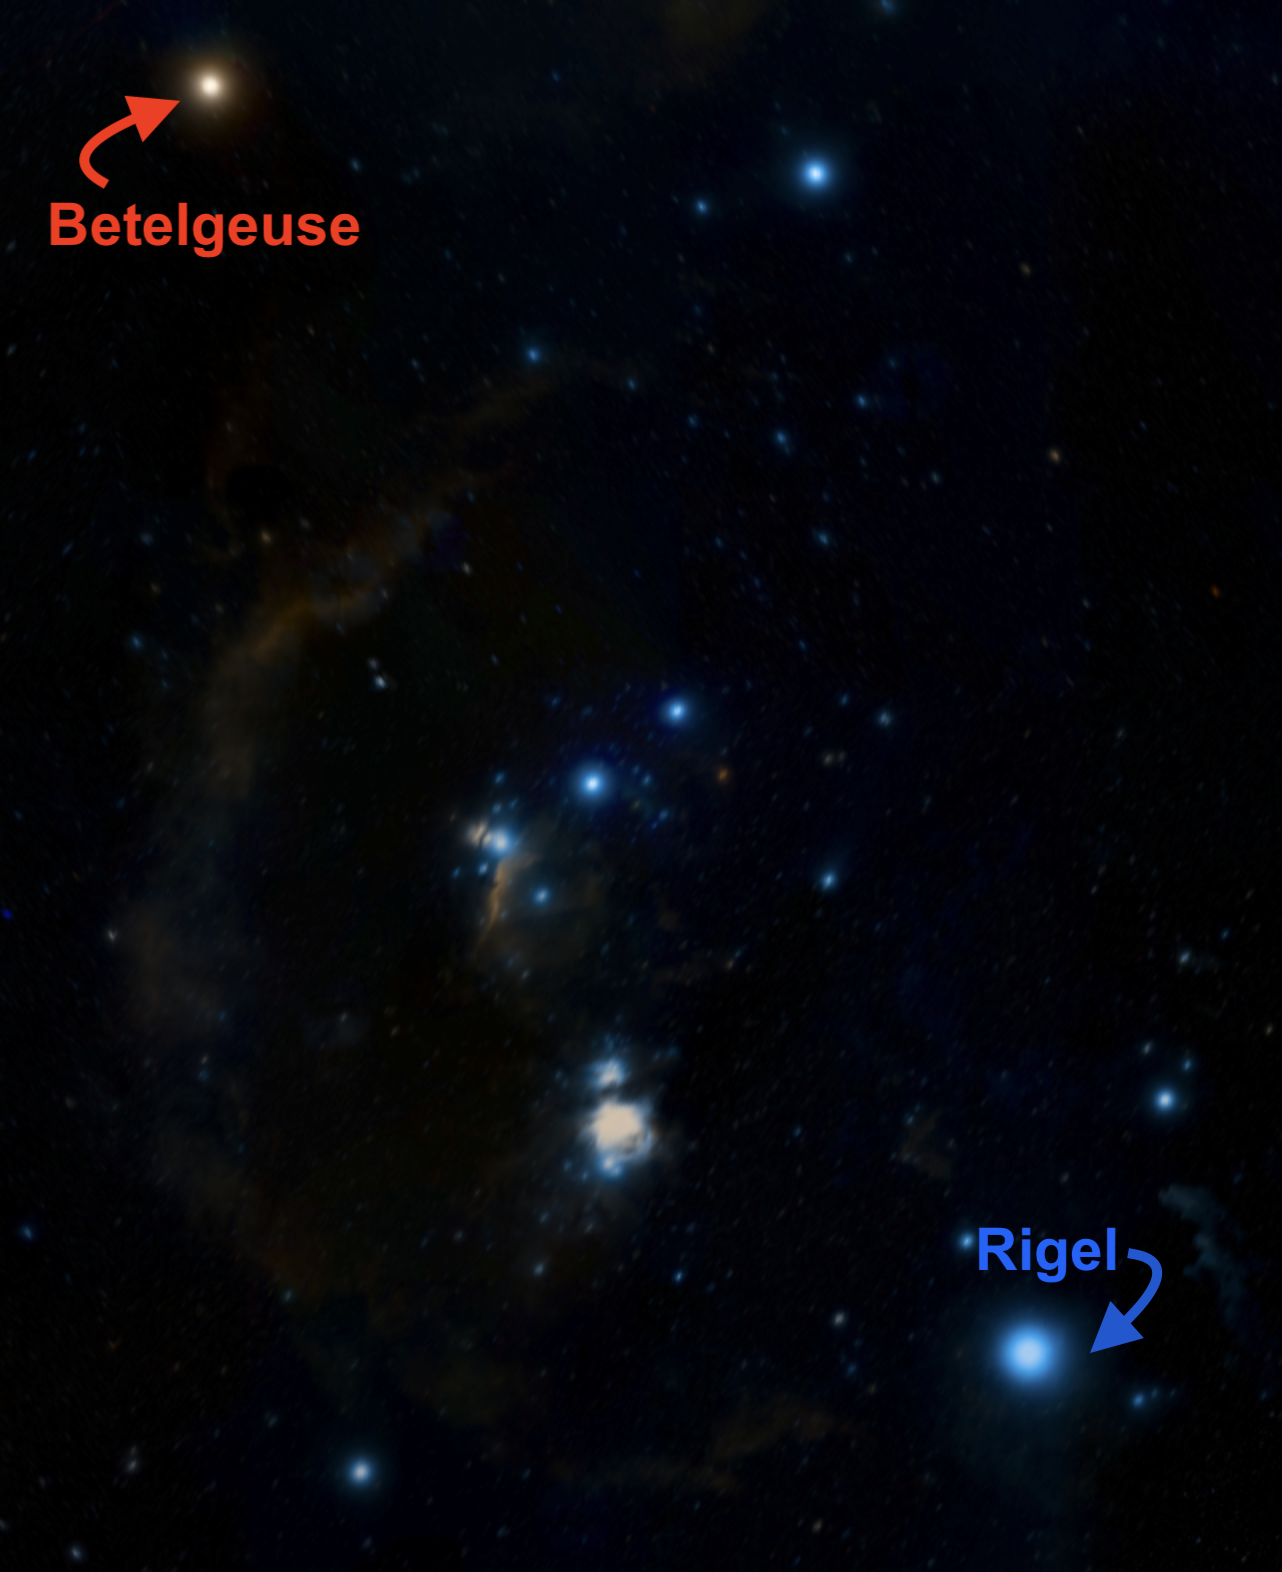
Stars are too far away (and too hot!) for a human to touch, yet we can measure their temperatures. Spectra make this possible! Let’s investigate how.

Session 3 Tutorial:

Follow this tutorial which will recap some concepts you learned yesterday and share new ideas.

Answer questions 1-3 in the Session 3 Tutorial section of your Spectrum Notebook:

  1. What is the relationship between the wavelength and energy of light?
  2. Why might it be useful to display a spectrum graph as a scatter plot instead of a line chart?
  3. What parts of the electromagnetic spectrum are not displayed in the online Spectrum Tool?

Challenge 1

Color and Temperature

Answer the following questions in Challenge 1 of your Spectrum Notebook:

  • You see a red star and a blue star in the sky. Which do you think has the higher temperature?
  • Explain why you chose the answer you did.

Class Discussion

Return to instructor-led slideshow for a class-wide discussion on spectra and color.

After the discussion, continue to Challenge 2.

Challenge 2—Part I.

Spectra and Temperature

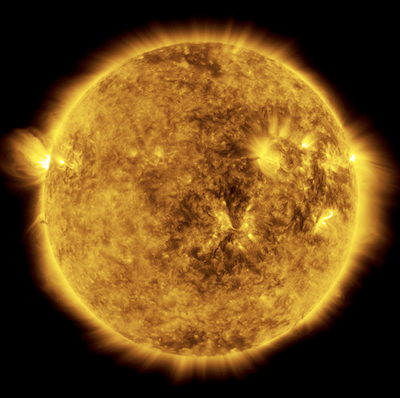
This is a spectrum of our Sun.

  • Drag the wavelength slider so you can see the whole spectrum.

Note the following in the table for Challenge 2, Part I of your Spectrum Notebook:

  • At what wavelength does the Sun emit the most light?
    (Meaning, where is the y-value roughly the highest?)
  • What is the energy associated with that wavelength?
    (Use the measuring tool—but first change the measurement unit to electron volts!)
  • Based on the brightness of light across the visible part of the spectrum, what color would you expect this type of star to appear?

Class Discussion

Return to instructor-led slideshow for a class-wide discussion on Thermal Emission.

After the discussion, continue to Part II

Challenge 2—Part II.

Measuring star temperatures

Top Panel: Recall this spectrum of the Sun.

Bottom panel: Multiple thermal spectra models for different temperatures (in Kelvins).

Return to the table in Challenge 2, Part I of your Spectrum Notebook:

  • Compare the spectrum of the Sun with the model spectra.
  • What temperature thermal (blackbody) spectrum best matches the Sun’s spectrum?

Note: The y-values of these model spectra are not plotted on the same scale—they have been modified so they can all be plotted in the range of the tool. The key is to compare the overall shape of the curves, and most importantly, where the peaks are.

Challenge 3.

How hot is an incandescent light bulb?

Top panel: The spectrum of an incandescent light bulb (where a metal filament is heated to such a high temperature that it glows).

Bottom panel: Multiple thermal spectra models for different temperatures (in Kelvins).

  • Compare the spectrum of the light bulb with the model spectra.
  • What temperature thermal spectrum best matches the incandescent light bulb?
  • How does the temperature of the light bulb compare with the temperature on the surfaces of the stars you investigated in Challenge 2?

Write your answers in Challenge 3 of your Spectrum Notebook.

Challenge 4.

What is Earth’s temperature?

Top panel: The spectrum of Earth’s emission as measured from space.

Bottom panel: Multiple thermal spectra models for different temperatures (in Kelvins).

  • Which model thermal spectrum best matches the Earth’s emission spectrum?
  • Convert the temperature you identified in Question 1 from Kelvins to Celsius.
  • What type of light does Earth emit?
  • Given that Earth does not emit its own visible light, how are we able to see Earth from space? (Recall from Session 1 that light can be emitted, reflected, absorbed, and transmitted.)

Write your answers in Challenge 4 of your Spectrum Notebook.

Session complete


Nice work!


Check back in with your instructor for an end of class discussion.

Target Object

Image Holder icon

More Light  

Wavelength (Microns)

This bar represents the spectrum image—what you see through a spectroscope when a light source is split by a diffraction grating into its component wavelengths (or colors, or energies).

Back
Next

plot type
measurement unit

Drag to the left to bring the spectrum into view.

Close

This measuring tool dropdown menu lets you choose the units (in wavelength or energy) that are reported by the measuring tool.

Back
Next

Comparison Object

calendar icon
Comparison Object Name

More Light  

Wavelength (Microns)

Blue and Red Stars


drawIndicatorMousePos:


X-Axis Slider:

Y-Axis Slider: