This bar represents the spectrum image—what you see through a spectroscope when a light source is split by a diffraction grating into its component wavelengths (or colors, or energies).
Back
Next
For this project, you’ll first explore how land plants reflect light. Then you’ll dive into the project by investigating a variety of plants, fish and coral that live in saltwater aquaria. You’ll choose a few to live in your tank. Based on what you’ve learned in this unit, you’ll decide how to light the tank so all of its inhabitants thrive.
Why are trees green in summer?
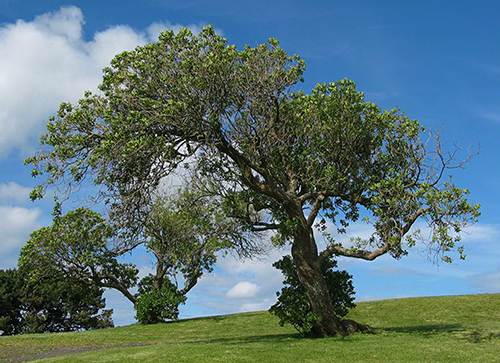
In this tree, some photons are reflected while others are absorbed.
This is a reflection spectrum of a tree in summer.
Use this spectrum to answer the questions in your Spectrum Notebook.
Interpreting reflection spectra
The top panel shows the reflection spectrum of the body a cactus.
The bottom panel shows the reflection spectrum of a pansy (a type of flower).
Based on the reflection spectra, what color do you think these plants appear under white light? under a different colored light?
Write your answers in your Spectrum Notebook.
Interpreting reflection spectra
Here are images of the actual cactus and pansy. How did you do with your color predictions?
Now that you’ve explored reflection in plants, you’re ready to think about reflection of sea plants (alage) and animals (coral and fish). Complete the activities in the notebook and come back here when the notebook instructs you to use the online tool.
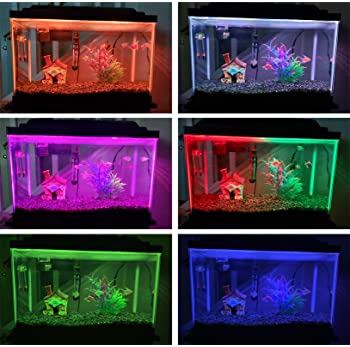
The top dropdown menu lets you choose different amounts (High, Medium, or Low) of the colors Red, Green, and Blue. There are also 2 sample mixed colors (orange and teal) that are shown in your Spectrum Notebook. Notice the shape, location and height (intensity) of these spectra.
With these reference graphs as guides, use the drawing tool in the bottom panel to create a graph of the overall color of your empty tank. Take a screenshot and paste it in your notebook.
Note: The reference graphs in your Notebook for the fish and plant reflection spectra are given in nanometers, so you can change your measurement unit to nm for this activity.
The top dropdown menu lets you choose different amounts (High, Medium, or Low) of the colors Red, Green, and Blue. as well as Orange and Teal examples.
With these reference graphs as guides, use the drawing tool in the bottom panel to create a graph of the “mood lighting” or your empty tank. Take a screenshot and paste it in your notebook.
Note: The reference graphs in your Notebook for the fish and plant reflection spectra are given in nanometers, so you can change your measurement unit to nm for this activity.
You’ve finished Fish Tank of the Spectrum Lab.
At this point you should rejoin the rest of your class for a closing discussion of the day’s content.