Interpret Your Results
What’s Going On?
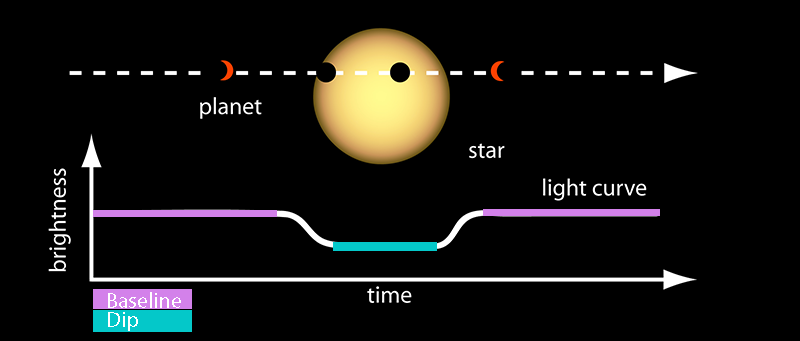
During an exoplanet transit, the star’s brightness appears the same for a while but then dims when the planet crosses in front of it. When the planet no longer blocks the starlight, the star appears as bright as it did originally.
Use your data, your scientific model, and your knowledge of physics to build a portrait of your planet. Amazingly, your graph can be decoded to tell you a lot about your planet. Your challenge is to determine:
- Have I really detected a planet? What evidence do I have that the jumble of dots on my graph represents a distant, alien world circling another star?
- If so, how large is the planet?
- Is the planet's orbit tilted, as seen from Earth?
- How fast does the planet move? How close is the planet to its star?
- What might the climate on this planet be like? What are the prospects for life on the planet?
Remember, in real science there are only results—not textbook answers. So gather your evidence, keep an open mind, and don't be afraid to voice any uncertainties in your results and conclusions.
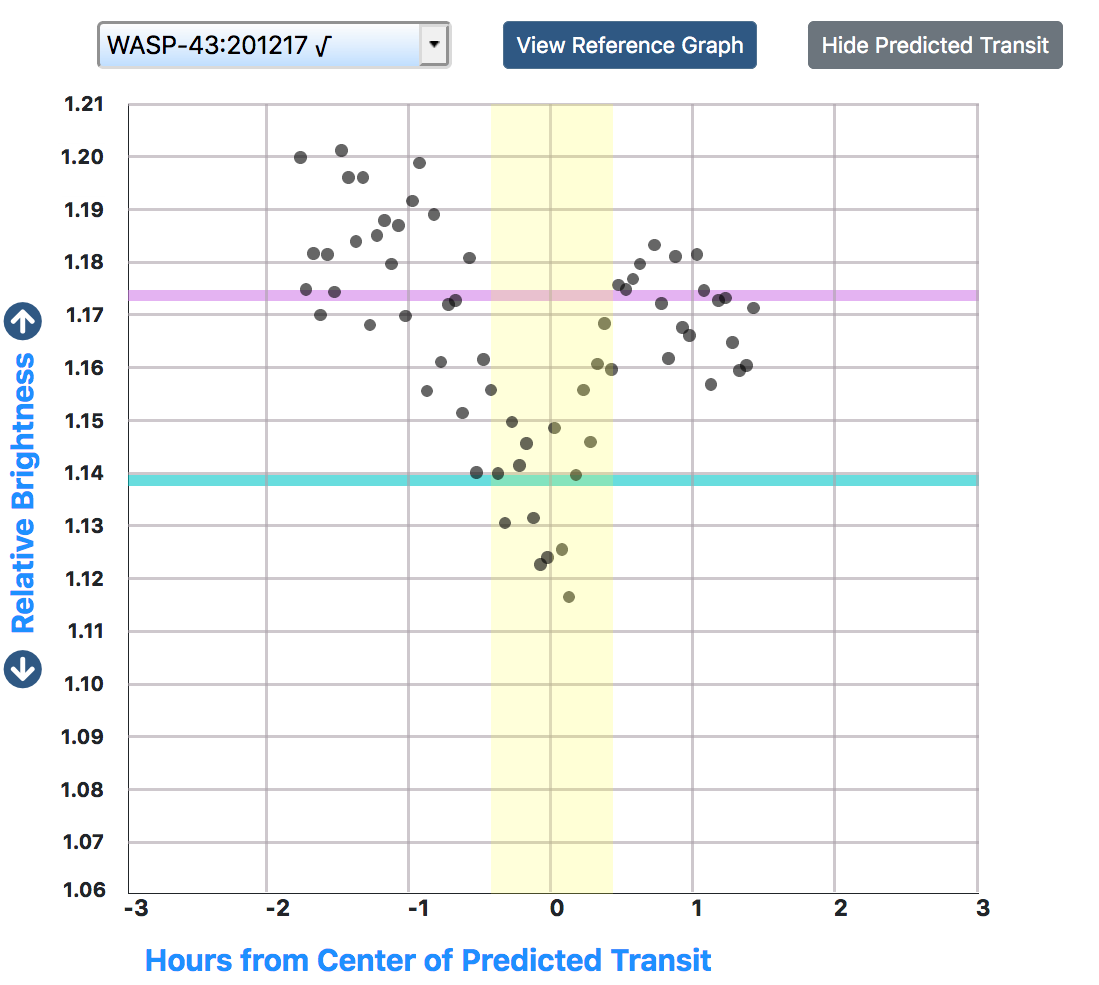
What's your initial judgement? Examine the data that you and others have gathered. Looking only at the data in your graph, do you think you have detected a planet... or are you not sure at this point? (There is no "textbook answer" here. Let your data guide your conclusions... but try to present as much evidence as you can.)
Extraordinary claims call for extraordinary evidence. Fortunately, you have more evidence than you think. Look at the observations of others. Compare your prediction. Compare your estimate for the duration of the transit with the astronomers' predicted duration. Do your observations support the prediction? (The prediction is approximate and may not correspond exactly to your findings.)
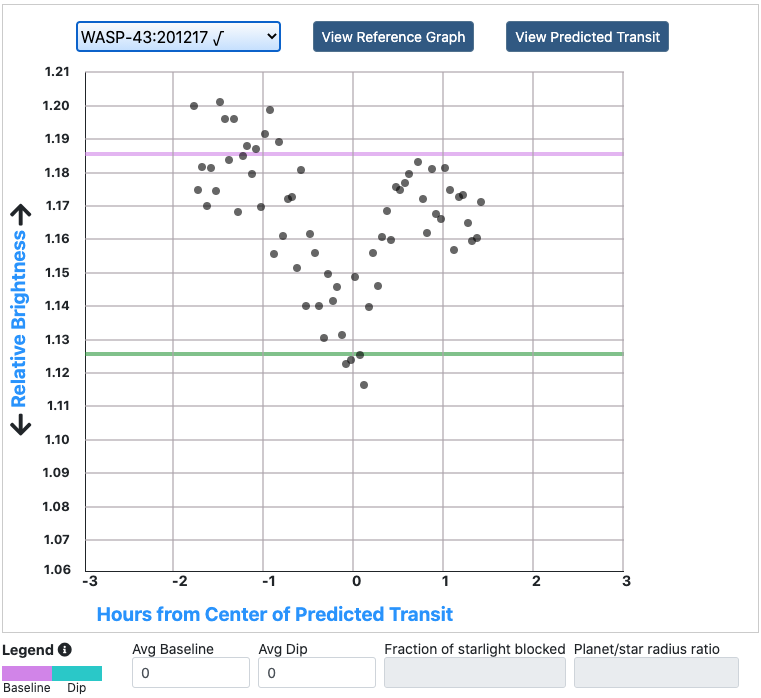
Determine your transit depth
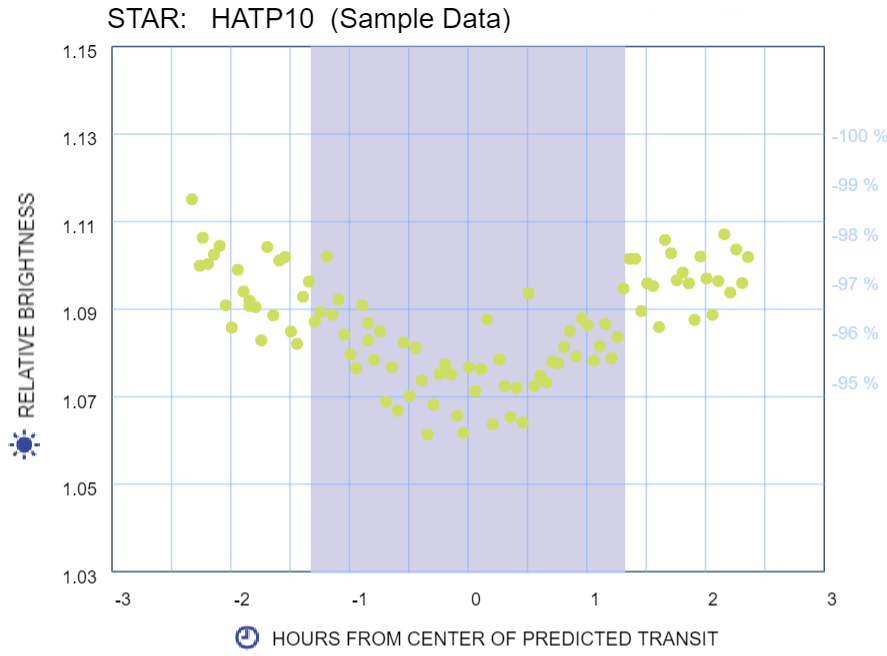
Click and drag the pink line up or down to where you think the baseline should be. That's the star's brightness when there is no transit. Drag the teal line up or down to where you think the average minimum brightness should be measured—the dip.
Note: The time axis does not show the time of night. Instead, it shows the hours before or after the predected center of the transit. Astronomers have made this prediction based on previous observations of this star.
Have you detected an exoplanet?
To estimate the size of your planet, you'll first need to accurately measure the depth of the transit—the dip in your graph. The adjustable model curve will help you make the measurement.
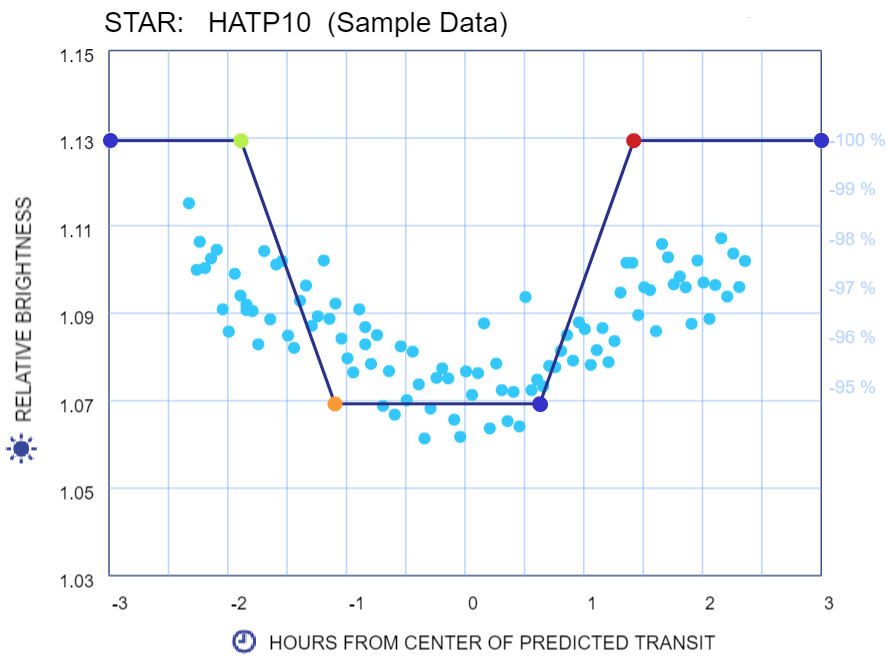
The curve shows the general shape of a transit: There's a baseline brightness before the transit; a sloping part where the transit starts; and a bottom line where the planet is fully in front of its star. The shape is symmetrical around the center of the transit. It should be similar to your own model after measuring the brightness.
Click and drag the green circle up or down, to where you think the baseline should be. That's the star's brightness when there is no transit. Drag the same circle left or right to where you thing the transit starts. Drag the red circle where you think the transit ends. Drag the orange circle up or down, to where you think the minimum brightness should be measured‐the dip, and drag the same circle left or right, to where you think the planet first passes fully in front of its star. This curve is your first estimate for a transit model that fits your data. But there is a more accurate way...
How large is your planet?
Finding the Best-Fitting Model.
This tool can help you find the transit model that best fits your data. Use it by moving the same circles to how low a number you can get—my best score. The score shows the total vertical distance from all the data points to the model line‐the sum of gray lines. The best-fitting model is the one for which this distance is the least. This model is "best" because it is closest to all your observations.
The uncertainty is based on the amount of scatter in your data (the less the better). If you could repeat your investigation many times under the same conditions, 95% of the time you'll get a result within these bounds.
To determine your planet's size, first find the fraction of the star's light blocked by the planet. You can find this from your baseline and dip measurements. Then take the square root of this fraction. The result is the planet's width compared to the star's width.

Visualizing your planet's size.
Watch for the planet to orbit in front of its star, at left. Then press the keyboard letter "s" to stop the planet. Adjust the model curve, and watch the planet's size respond. Notice that the bigger the dip, the bigger the planet must be to block that much starlight.
After you've got your best model curve, compare your planet's size with Juniper and the Earth, at right.
Given the scatter in your data, do you think you could detect a planet as small as Earth, using this telescope? Or, would you need more precsion data?
Is the planet's orbit tilted?
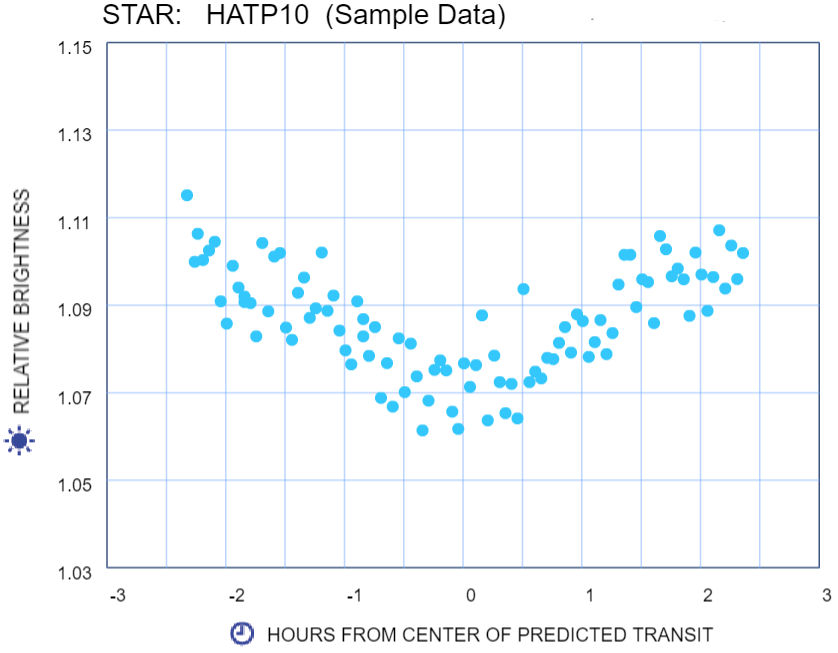
The shape of your curve reveals whether the planet's orbital plane is tilted, as seen from Earth
Take a look at the brightness curve that goes with each of the models. Do the curves make sense to you? Based on your data, do you think your planet's orbit is more tilted or edge-on?

How close is my planet to its star?
There is a relationship between distance and transit time.
The closer a planet is to its star, the faster it moves—and so the shorter its transit time.
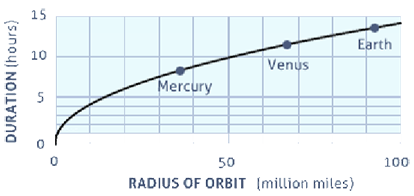
From Newton's or Kepler's laws, you can derive the connection between a planet's speed (v) and the radius (R) of its orbit. The result is  where the constant k involves the mass of the star. Since the transit time (t) is approximately proportional to 1/v, you can use the following relationship
  where the radius of the orbit is proportional to the square of the transit duration. Planets of our own solar system obey this relationship.
Assume that your star is similar in size and mass to our own sun. Then you can use the radius of orbit graph shown to find where your planet would lie if it were in our own solar system. First use the data you collected for your planet to estimate the transit time, in hours. Then read off the corresponding orbital radius form the graph shown.
How big?
To determine your planet’s size, first find the fraction of the star’s light blocked by the planet. You can find this from the relative brightness values for the baseline and dip in your light curve.
Then, take the square root of this fraction. The result is the planet’s radius compared to the star’s radius.
For example, for a light curve that shows an average baseline value of 1.10 and an average dip level of 1.07, the fraction of starlight blocked is (1.10-1.07)/1.10 = 0.027. The SqRt of 0.027 = 0.17, meaning the planet/star radius ratio of 0.17
